Comprehensive Physiology offers downloadable PowerPoint presentations of figures for
non-profit, educational use, provided the content is not modified and full credit is given to the
author and publication.
Figure 1. Schematic representation of the systemic gas transport and exchange.
Figure 2. (A) Oxygen consumption as a function of body mass for mice, rats, and humans at rest (blue symbols) and during maximal exercise (red symbols). (B) Mass‐specific oxygen consumption as a function of body mass. Each data point represents average values obtained in the studies listed as follows. Data obtained from the following references. Mice: (17,18,21,30,48,50,53,69,100,139,177,193,237,242,249,250,263,264,292), rats: (1,5,11,35,80,82,83,91,110,111,115,126,140,149,152,172,174,180,183,186,187,188,189,219,221,222,242,259,288), and humans: (2,28,57,101,123,178,179,190,191,236,245,246,257,263,262,264,279,280,294).
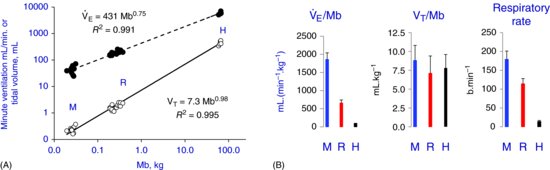
Figure 3. (A) Minute ventilation (solid symbols) and tidal volume (open symbols) as a function of body mass for mice (M), rats (R), and humans (H). Each data point represents average values obtained in the studies listed as follows. (B) Species mean values for the data presented in A. Data obtained from the following references. Mice: (12,18,47,65,104,105,133,148,157,168,211,244,249,250), rats: (16,63,66,67,89,104,134,194,195,210,211,240,256), and humans: (13,14,37,40,56,57,245,250,282).
Figure 4. Mb, , and are the averages for each species of the data presented in Figures 2 and 3. is the ratio of the averages of these values. For calculation of FEO2 and FAO2, see text.
Figure 5. (A) Total lung capacity (blue symbols) and lung diffusing capacity for CO (red symbols) as a function of body mass. Each data point represents average values obtained in the studies listed as follows. (B) DLCO data in A are plotted against the corresponding TLC. The data presented were obtained from the following references. Mice: (47,217,218,177,278), rats: (14,36,15,27,149,254,260,90,135,205,206,213,290,291), and humans: (71,102,247,94,103,169,208,246,248,274,289,294,295).
Figure 6. (A) Average values of the PO2 gradient for diffusion (mean alveolar PO2 - mean capillary PO2) estimated from the ratio /DLO2 for rats and humans, plotted as a function of body mass. For details of the calculation of /DLO2, see text. (B) Theoretical time course of pulmonary capillary PO2 as a function of pulmonary transit time for mice, rats, and humans. The numbers indicate the mean capillary PO2 value in each case. For details, see text.
Figure 7. Top: Resting values for cardiac output, heart rate, and stroke volume for mice, rats, and humans. Each data point represents the average value of studies listed as follows. Bottom: Mass adjusted resting cardiac output, arterial O2 concentration, and mass adjusted convective O2 delivery. Mass adjusted values for cardiac output were obtained using the body mass values reported in the corresponding references. CaO2 was obtained from the average values of the references in Figure 8A. was obtained by multiplying the average mass adjusted value shown at the top, times the average CaO2. Data were obtained from the following references. Mice: (7,29,69,107,114,117,131,151,241,271,277,281,285,287), rats: (32,42,43,44,82,92,108,145,146,176,243), and humans: (10,39,68,129,170,220,234,251).
Figure 8. (A) O2 dissociation curve showing arterial and mixed venous O2 contents as a function of their respective PO2 values. Resting values of arterial and mixed venous data for humans and rats, and arterial PO2 for mice are from measurements reported in the references listed as follows. For calculation of the O2 content values of mice see text. Data were obtained from the following references. Mice: (154), rats: (58,59,83,85,111,163), and humans: (9,232,233,257,274,297). (B) Average values for O2 consumption, convective O2 delivery, and O2 extraction ratio average resting values are from Figure 2, from Figure 7B, and O2 extraction ratio calculated from the data in 7A.
Figure 9. Pulmonary gas exchange in rats and humans at rest, and during exercise. Alveolar ventilation (A), and arterial PCO2 (B), as a function of CO2 production. (C) Arterial PO2 as a function of arterial PCO2. (D) Alveolar‐to‐arterial PO2 difference, as a function of O2 consumption. Each data point represents average values obtained in the studies listed as follows. Data for these figures were obtained from the following references. Rats: (11,58,67,80,83,84,85,115,186,187,188,189) and humans: (101,136,231,163,257,262,274).
Figure 10. Convective O2 delivery to the tissues during exercise in rats and humans. (A) O2 consumption plotted as a function of convective O2 delivery. The slopes of the diagonal straight lines indicate different tissue O2 extraction ratios. (B) O2 dissociation curve indicating the composition of arterial and mixed venous blood of rats and humans at rest and different levels of exercise. (C) Cardiac output as a function of O2 consumption at rest and different levels of exercise. The straight diagonal lines indicate different values of arterio‐venous O2 differences. Data for these figures were obtained from the references listed for Figure 9.
Figure 11. Heart rate (A), and stroke volume (B) values as a function of O2 consumption at rest and different levels of exercise in rats and humans. Each data point represents average values obtained in the studies listed as follows. Data for these figures were obtained from the references listed for Figure 9.
Figure 12. Acid‐base balance changes from rest to exercise in rats and humans. (A) Plasma HCO3 concentration as a function of pH showing PCO2 isobars for 20 and 40 Torr. (B) Plasma pH as a function of O2 consumption at rest and during exercise. (C) Base deficit and (D) blood lactate concentration as a function of O2 consumption at rest and during exercise. Each data point represents average values obtained in the studies listed as follows. Data for these figures were obtained from the references listed for Figure 9.
Figure 13. Ventilatory response to acute hypoxia in humans and rats, as % of the normoxic control. (A) Minute ventilation, (B) tidal volume, and (C) respiratory frequency as a function of inspired O2 concentration. Each data point represents average values obtained in the studies listed as follows. Data for these figures were obtained from the following references. Mice: (8,12,65,95,104,105,130,268,133,210,211,245,250,265), rats: (49,75,99,116,147,160,164,165,184,204,235,240,256,276,282), and humans: (5,9,37,137,163,225,227,250,238,253,262).
Figure 14. (A) Effect of decreasing inspired O2 on resting O2 consumption in mice, rats, and humans. Each data point represents average values obtained in the studies listed as follows. Data for this figure were obtained from the following references. Mice: (65,119,249), rats: (65,99,76,116,165,183), and humans: (163,250,274). (B) Pulmonary gas exchange during acute hypoxia in the mice, rats, and humans. Each data point represents average values obtained in the studies listed as follows. Data for this figure were obtained from the following references. Mice: (141,154), rats: (156,160,164,184,235,282), and humans: (5,37,137,163,250,253,262).
Figure 15. Effects of acute hypoxia on maximal O2 consumption in humans and rats. Each data point represents average values obtained in the studies listed as follows. Data for this figure were obtained from the following references. Humans: (9,23,137,179) and rats: (77,82,83,111,173).
Figure 16. (A) Arterial PO2 as a function of inspired PO2 during maximal hypoxic exercise in humans and rats. References as in Figure 15. (B) Comparison of PaO2 values at rest and during maximal exercise in humans and rats. Each data point represents average values obtained in the studies listed as follows. References as in Figure 15.
Figure 17. (A) Arterial PCO2 as a function of arterial PO2 during maximal exercise in humans and rats. (B) Alveolar‐to‐ arterial PO2 difference as a function of arterial PO2 during maximal exercise. References as in Figure 15.
Figure 18. A comparison of the effects of acute hypoxia on the pulmonary gas exchange of rats and humans at rest and during maximal exercise. Data, from rats (reference (87)) was compared with data, from humans in acute hypoxia (reference (274)). A‐aDO2, alveolar to arterial PO2; difference, Dapp, “Apparent lung diffusing capacity” (see text); ß, slope of the O2 dissociation curve; , cardiac output. Data for this figure were obtained from reference (87) which consisted of an analysis comparing (rats) which, in turn, consisted on an analysis of original data from.
Figure 19. Effects of a change in Hb P50 on arterial and mixed venous PO2 and on the alveolar‐to‐arterial PO2 difference. Data for this figure were obtained from references (111) and (173).
Figure 20. Effects of acute hypoxia on convective O2 delivery and cardiac output during maximal exercise. Each data point represents average values obtained in the studies listed as follows. Data for this figure were obtained from the following references. Rats: (76,77,79,105,106,107) and humans: (9,22,132,170,223,224,267).
Figure 21. (A) Tissue O2 extraction ratio during maximal hypoxic and normoxic exercise in rats and humans (B) Maximal O2 consumption as a function of mixed venous PO2 during maximal hypoxic and normoxic exercise in rats and humans. Each data point represents average values obtained in the studies listed as follows. References as Figure 20.
Figure 22. Average values for maximal O2 consumption, maximal rate of convective O2 delivery, arterial blood O2 content and maximal cardiac output during normoxia (Nx), acute hypoxia (AHx), chronic hypoxia (Chx), and return to normoxia after acclimatization (Acc Nx) Each data point represents the average of values obtained in the studies listed as follows. The data for rats were obtained from reference (83), and for humans, from reference (14).
Figure 23. Rest: Time course of arterial PCO2 changes during acclimatization to hypoxia in rats and humans. Data obtained from reference (195). Exercise: Arterial PCO2 as a function of arterial PO2 at rest and during maximal normoxic and hypoxic exercise in rats and humans. Ventilatory acclimatization is evidenced by the lower PaCO2 for a given PaO2 in acclimatized (triangles) versus nonacclimatized (circles) individuals. Each data point represents average values obtained in the studies listed as follows. Data were obtained from references (47) (rats) and (257) and (272) (humans).
Figure 24. Effects of acclimatization to hypoxia on efficacy of pulmonary gas exchange during maximal exercise. Each data point represents average values obtained in the studies listed as follows. Data obtained from references (83) and (87) for rats and (70) and (257) for humans.
Figure 25. Blood Hb concentration in normoxia and chronic hypoxia as a function of inspired PO2. Each data point represents average values obtained in the studies listed as follows. Data obtained from references (83,88,110) for rats and (24,25,26) for humans.
Figure 26. Effect of isovolumic changes in hematocrit on the determinants of maximal O2 consumption of rats acclimatized and nonacclimatized to hypoxia. Data obtained from reference (85).
Figure 27. Effect of isovolumic changes in hematocrit on tissue O2 extraction (A) and capillary‐to‐cell O2 diffusion (B) in rats exercising maximally in hypoxia and normoxia. Data obtained from reference (85).
Figure 28. Maximal O2 consumption as a function of mixed venous PO2 during maximal exercise in hypoxia and normoxia of high‐capacity (HCR) and low‐capacity (LCR) runners of generations 7 and 15. For details, see text. Each data point represents average values obtained in the studies listed as follows. Data obtained from references (86) and (112).
Figure 29. Tissue O2 diffusing capacity, determined during hypoxic and normoxic exercise as a function of capillary density of the medial gastrocnemius of rats. HCR, high‐capacity runners; LCR, low‐capacity runners. Each data point represents average values obtained in the studies listed as follows. Data obtained from references (124,125).
Figure 30. Time course of arterial blood gases (A) and hematopoietic responses (B) to prolonged exposure to hypoxia in two strains of rats: Hilltop and Madison. Data obtained from references (198,199).
Figure 1. Schematic representation of the systemic gas transport and exchange.
Figure 2. (A) Oxygen consumption as a function of body mass for mice, rats, and humans at rest (blue symbols) and during maximal exercise (red symbols). (B) Mass‐specific oxygen consumption as a function of body mass. Each data point represents average values obtained in the studies listed as follows. Data obtained from the following references. Mice: (17,18,21,30,48,50,53,69,100,139,177,193,237,242,249,250,263,264,292), rats: (1,5,11,35,80,82,83,91,110,111,115,126,140,149,152,172,174,180,183,186,187,188,189,219,221,222,242,259,288), and humans: (2,28,57,101,123,178,179,190,191,236,245,246,257,263,262,264,279,280,294).
Figure 3. (A) Minute ventilation (solid symbols) and tidal volume (open symbols) as a function of body mass for mice (M), rats (R), and humans (H). Each data point represents average values obtained in the studies listed as follows. (B) Species mean values for the data presented in A. Data obtained from the following references. Mice: (12,18,47,65,104,105,133,148,157,168,211,244,249,250), rats: (16,63,66,67,89,104,134,194,195,210,211,240,256), and humans: (13,14,37,40,56,57,245,250,282).
Figure 4. Mb, , and are the averages for each species of the data presented in Figures 2 and 3. is the ratio of the averages of these values. For calculation of FEO2 and FAO2, see text.
Figure 5. (A) Total lung capacity (blue symbols) and lung diffusing capacity for CO (red symbols) as a function of body mass. Each data point represents average values obtained in the studies listed as follows. (B) DLCO data in A are plotted against the corresponding TLC. The data presented were obtained from the following references. Mice: (47,217,218,177,278), rats: (14,36,15,27,149,254,260,90,135,205,206,213,290,291), and humans: (71,102,247,94,103,169,208,246,248,274,289,294,295).
Figure 6. (A) Average values of the PO2 gradient for diffusion (mean alveolar PO2 - mean capillary PO2) estimated from the ratio /DLO2 for rats and humans, plotted as a function of body mass. For details of the calculation of /DLO2, see text. (B) Theoretical time course of pulmonary capillary PO2 as a function of pulmonary transit time for mice, rats, and humans. The numbers indicate the mean capillary PO2 value in each case. For details, see text.
Figure 7. Top: Resting values for cardiac output, heart rate, and stroke volume for mice, rats, and humans. Each data point represents the average value of studies listed as follows. Bottom: Mass adjusted resting cardiac output, arterial O2 concentration, and mass adjusted convective O2 delivery. Mass adjusted values for cardiac output were obtained using the body mass values reported in the corresponding references. CaO2 was obtained from the average values of the references in Figure 8A. was obtained by multiplying the average mass adjusted value shown at the top, times the average CaO2. Data were obtained from the following references. Mice: (7,29,69,107,114,117,131,151,241,271,277,281,285,287), rats: (32,42,43,44,82,92,108,145,146,176,243), and humans: (10,39,68,129,170,220,234,251).
Figure 8. (A) O2 dissociation curve showing arterial and mixed venous O2 contents as a function of their respective PO2 values. Resting values of arterial and mixed venous data for humans and rats, and arterial PO2 for mice are from measurements reported in the references listed as follows. For calculation of the O2 content values of mice see text. Data were obtained from the following references. Mice: (154), rats: (58,59,83,85,111,163), and humans: (9,232,233,257,274,297). (B) Average values for O2 consumption, convective O2 delivery, and O2 extraction ratio average resting values are from Figure 2, from Figure 7B, and O2 extraction ratio calculated from the data in 7A.
Figure 9. Pulmonary gas exchange in rats and humans at rest, and during exercise. Alveolar ventilation (A), and arterial PCO2 (B), as a function of CO2 production. (C) Arterial PO2 as a function of arterial PCO2. (D) Alveolar‐to‐arterial PO2 difference, as a function of O2 consumption. Each data point represents average values obtained in the studies listed as follows. Data for these figures were obtained from the following references. Rats: (11,58,67,80,83,84,85,115,186,187,188,189) and humans: (101,136,231,163,257,262,274).
Figure 10. Convective O2 delivery to the tissues during exercise in rats and humans. (A) O2 consumption plotted as a function of convective O2 delivery. The slopes of the diagonal straight lines indicate different tissue O2 extraction ratios. (B) O2 dissociation curve indicating the composition of arterial and mixed venous blood of rats and humans at rest and different levels of exercise. (C) Cardiac output as a function of O2 consumption at rest and different levels of exercise. The straight diagonal lines indicate different values of arterio‐venous O2 differences. Data for these figures were obtained from the references listed for Figure 9.
Figure 11. Heart rate (A), and stroke volume (B) values as a function of O2 consumption at rest and different levels of exercise in rats and humans. Each data point represents average values obtained in the studies listed as follows. Data for these figures were obtained from the references listed for Figure 9.
Figure 12. Acid‐base balance changes from rest to exercise in rats and humans. (A) Plasma HCO3 concentration as a function of pH showing PCO2 isobars for 20 and 40 Torr. (B) Plasma pH as a function of O2 consumption at rest and during exercise. (C) Base deficit and (D) blood lactate concentration as a function of O2 consumption at rest and during exercise. Each data point represents average values obtained in the studies listed as follows. Data for these figures were obtained from the references listed for Figure 9.
Figure 13. Ventilatory response to acute hypoxia in humans and rats, as % of the normoxic control. (A) Minute ventilation, (B) tidal volume, and (C) respiratory frequency as a function of inspired O2 concentration. Each data point represents average values obtained in the studies listed as follows. Data for these figures were obtained from the following references. Mice: (8,12,65,95,104,105,130,268,133,210,211,245,250,265), rats: (49,75,99,116,147,160,164,165,184,204,235,240,256,276,282), and humans: (5,9,37,137,163,225,227,250,238,253,262).
Figure 14. (A) Effect of decreasing inspired O2 on resting O2 consumption in mice, rats, and humans. Each data point represents average values obtained in the studies listed as follows. Data for this figure were obtained from the following references. Mice: (65,119,249), rats: (65,99,76,116,165,183), and humans: (163,250,274). (B) Pulmonary gas exchange during acute hypoxia in the mice, rats, and humans. Each data point represents average values obtained in the studies listed as follows. Data for this figure were obtained from the following references. Mice: (141,154), rats: (156,160,164,184,235,282), and humans: (5,37,137,163,250,253,262).
Figure 15. Effects of acute hypoxia on maximal O2 consumption in humans and rats. Each data point represents average values obtained in the studies listed as follows. Data for this figure were obtained from the following references. Humans: (9,23,137,179) and rats: (77,82,83,111,173).
Figure 16. (A) Arterial PO2 as a function of inspired PO2 during maximal hypoxic exercise in humans and rats. References as in Figure 15. (B) Comparison of PaO2 values at rest and during maximal exercise in humans and rats. Each data point represents average values obtained in the studies listed as follows. References as in Figure 15.
Figure 17. (A) Arterial PCO2 as a function of arterial PO2 during maximal exercise in humans and rats. (B) Alveolar‐to‐ arterial PO2 difference as a function of arterial PO2 during maximal exercise. References as in Figure 15.
Figure 18. A comparison of the effects of acute hypoxia on the pulmonary gas exchange of rats and humans at rest and during maximal exercise. Data, from rats (reference (87)) was compared with data, from humans in acute hypoxia (reference (274)). A‐aDO2, alveolar to arterial PO2; difference, Dapp, “Apparent lung diffusing capacity” (see text); ß, slope of the O2 dissociation curve; , cardiac output. Data for this figure were obtained from reference (87) which consisted of an analysis comparing (rats) which, in turn, consisted on an analysis of original data from.
Figure 19. Effects of a change in Hb P50 on arterial and mixed venous PO2 and on the alveolar‐to‐arterial PO2 difference. Data for this figure were obtained from references (111) and (173).
Figure 20. Effects of acute hypoxia on convective O2 delivery and cardiac output during maximal exercise. Each data point represents average values obtained in the studies listed as follows. Data for this figure were obtained from the following references. Rats: (76,77,79,105,106,107) and humans: (9,22,132,170,223,224,267).
Figure 21. (A) Tissue O2 extraction ratio during maximal hypoxic and normoxic exercise in rats and humans (B) Maximal O2 consumption as a function of mixed venous PO2 during maximal hypoxic and normoxic exercise in rats and humans. Each data point represents average values obtained in the studies listed as follows. References as Figure 20.
Figure 22. Average values for maximal O2 consumption, maximal rate of convective O2 delivery, arterial blood O2 content and maximal cardiac output during normoxia (Nx), acute hypoxia (AHx), chronic hypoxia (Chx), and return to normoxia after acclimatization (Acc Nx) Each data point represents the average of values obtained in the studies listed as follows. The data for rats were obtained from reference (83), and for humans, from reference (14).
Figure 23. Rest: Time course of arterial PCO2 changes during acclimatization to hypoxia in rats and humans. Data obtained from reference (195). Exercise: Arterial PCO2 as a function of arterial PO2 at rest and during maximal normoxic and hypoxic exercise in rats and humans. Ventilatory acclimatization is evidenced by the lower PaCO2 for a given PaO2 in acclimatized (triangles) versus nonacclimatized (circles) individuals. Each data point represents average values obtained in the studies listed as follows. Data were obtained from references (47) (rats) and (257) and (272) (humans).
Figure 24. Effects of acclimatization to hypoxia on efficacy of pulmonary gas exchange during maximal exercise. Each data point represents average values obtained in the studies listed as follows. Data obtained from references (83) and (87) for rats and (70) and (257) for humans.
Figure 25. Blood Hb concentration in normoxia and chronic hypoxia as a function of inspired PO2. Each data point represents average values obtained in the studies listed as follows. Data obtained from references (83,88,110) for rats and (24,25,26) for humans.
Figure 26. Effect of isovolumic changes in hematocrit on the determinants of maximal O2 consumption of rats acclimatized and nonacclimatized to hypoxia. Data obtained from reference (85).
Figure 27. Effect of isovolumic changes in hematocrit on tissue O2 extraction (A) and capillary‐to‐cell O2 diffusion (B) in rats exercising maximally in hypoxia and normoxia. Data obtained from reference (85).
Figure 28. Maximal O2 consumption as a function of mixed venous PO2 during maximal exercise in hypoxia and normoxia of high‐capacity (HCR) and low‐capacity (LCR) runners of generations 7 and 15. For details, see text. Each data point represents average values obtained in the studies listed as follows. Data obtained from references (86) and (112).
Figure 29. Tissue O2 diffusing capacity, determined during hypoxic and normoxic exercise as a function of capillary density of the medial gastrocnemius of rats. HCR, high‐capacity runners; LCR, low‐capacity runners. Each data point represents average values obtained in the studies listed as follows. Data obtained from references (124,125).
Figure 30. Time course of arterial blood gases (A) and hematopoietic responses (B) to prolonged exposure to hypoxia in two strains of rats: Hilltop and Madison. Data obtained from references (198,199).
Teaching Material
N. C. Gonzalez, I. Kuwahira. Systemic Oxygen Transport with Rest, Exercise, and Hypoxia: A Comparison of Humans, Rats, and Mice. Compr Physiol 8: 2018, 1537-1573.
Didactic Synopsis
Major Teaching Points:
Comparison of O2 transport characteristics is necessary to determine the applicability to humans of findings in rodents.
O2 is transported along four linked conductances: Ventilation, lung diffusion, blood transport, and tissue diffusion.
Mass/surface area relationships determine that resting heat loss and O2 consumption (VO2) are greater in rodents. While maximal VO2 is also greater, the difference maximal-resting VO2 is smaller in rodents
While mass-adjusted O2 fluxes are widely different, alveolar, arterial, and mixed venous PO2 values are similar in the three species.
Even though their mass-adjusted maximal VO2 is greater, rats maintain a smaller alveolar-to arterial PO2 difference than humans, both in hypoxia and in normoxia, suggesting greater efficacy of pulmonary gas exchange.
The patterns of adaptation of the O2 transport system to prolonged hypoxia are similar in rats and humans, making rats a useful experimental model of human acclimatization to hypoxia.
Didactic Legends
The figures—in a freely downloadable PowerPoint format—can be found on theImagestab along with the formal legends published in the article. The following legends to the same figures are written to be useful for teaching.
Figure 1Teaching points: The O2 transport system is viewed as composed of four linked conductances: Ventilation, alveolar capillary diffusion, circulatory convection, and tissue capillary-cell diffusion. Each conductance is defined as the ratio of the gas flow and the partial pressure difference across the conductance. Since the gas flow is the same in all conductances, the pressure gradients provide an estimate of the value of the conductance.
Figure 2Teaching points: An allometric coefficient smaller than 1 indicates that the increase in the value of the variable in question is smaller than the increase in body mass across species. Accordingly, when normalized for body mass, VO2 is greatest in mice and smallest in humans. The allometric coefficient for maximal exercise is still smaller than 1, but greater than that at rest: this has two implications: the differences among species are greater than those at rest, and also, the difference between resting and maximal VO2 is greatest in humans and smallest in mice.
Figure 3Teaching points: (A) The allometric coefficient for minute ventilation is less than 1, while that for tidal volume is essentially equal to 1. Accordingly, while mass-specific minute ventilation is highest in mice and lowest in humans, mass-specific tidal volume is essentially the same in the three species. (B) In other words, the greater mass-specific minute ventilation of the smaller species is the result of a similar tidal volume and a greater frequency compared to those of humans.
Figure 4Teaching points: Mass-specific O2 consumption and minute ventilation are vastly different in the three species; however, their ratios are similar. VE/VO2 is the ventilatory equivalent for O2, and represents the level of ventilation required for each unit of O2 consumption. The ventilatory equivalent for O2 is a major determinant of the alveolar gas composition, so for a given level of inspired PO2, the O2 concentration in the alveolar air will be a function of VE/VO2. This is illustrated in the figure that shows that calculated mix-expired and alveolar O2 concentrations are close in the three species. This, in turn, is consistent with the separate observation that resting arterial PO2 values are also similar in the three species.
Figure 5Teaching points: A shows that the allometric coefficients for both total lung capacity and the diffusing capacity for CO are close to unity; naturally, TLC and DLco vary in proportion to one another with an allometric coefficient near 1. This means that the overall capacity of the lung to allow transfer of gas from the alveolus to the capillary is closely related to the volume of the lung.
Figure 6Teaching points: Figure 6A is a plot of the PO2 diffusion gradient as a function of body mass. The PO2 diffusion gradient was calculated as the ratio of the O2 consumption to the lung diffusing capacity for O2. The objective of this figure is to illustrate the fact that it takes a greater driving force to transfer a unit of O2 across the alveolar-capillary barrier in smaller animals. Available evidence suggests that the difference in gradient is due to a lower mean capillary PO2 in the smaller species, since alveolar PO2 appears to be similar in the three species. The mechanisms responsible for the differences in capillary PO2 are not clear. Figure 6B illustrates a possible contributor, namely the species differences in blood O2 affinity of Hb. Other things being equal, the increase in blood PO2 associated with the transfer of a given amount of O2 as blood flows through the capillary will be smaller in the blood with higher Hb P50. Figure 6B, which plots capillary PO2 as a function of blood relative transit time, shows that the rate of increase capillary PO2 is slower in the rodents, such that mean capillary PO2 (underlined) is reached after a longer fraction of the capillary transit time in the rodents, which have higher blood P50. This, in turn determines that at any fraction of the capillary transit time the PO2 diffusion gradient will be greater in the smaller species.
Figure 7Teaching points: A shows a plot of cardiac output, heart rate, and stroke volume as a function of body mass. While cardiac output increases with body mass, heart rate decreases. The relationships are such that stroke volume increases as a function of body mass with an allometric coefficient near unity, which means that the mass adjusted stroke volume is essentially the same in the three species. In other words, as shown in B, the rodents achieve a greater mass-adjusted cardiac output than humans via a similar stroke volume and a greater heart rate. This is similar to ventilation, where mass-adjusted tidal volume is similar in the three species and the greater respiratory frequency determines a greater minute ventilation per unit body mass in the smaller species.
Figure 8Teaching points: Figure 8A shows a plot of blood O2 content as a function of PO2. The individual points indicate average values for arterial and mixed venous blood obtained in different studies. For specifics on the calculation of the mixed venous blood O2 content, see text. The arterial blood O2 content value is relatively similar in the three species, but the values of the mixed blood O2 content is markedly different; accordingly, the proportion of O2 extracted by the tissues, that is, the ratio of arterio-venous O2 content to the arterial O2 content, is greatest in mice and smallest in humans. Since the arterial blood O2 content is similar in the three species, and mass-specific cardiac output is highest in mice and lowest in humans, it follows that the mass-adjusted rate of O2 delivery to the tissues, QO2, is also highest in mice. VO2 can be thought of as the product of the rate of O2 delivery times the proportion of O2 extraction. Figure 8B shows that the greater mass-adjusted VO2 of rodents is achieved by a combination of greater rate of delivery of O2 to the tissues together with a greater percentage of the delivered O2 extracted by the tissues.
Figure 9Teaching points: This figure compares the effects of exercise on pulmonary gas exchange of rats and humans. 9A shows that for a given level of mass-adjusted CO2 production (which is an indication of the intensity of exercise), the level of alveolar ventilation is greater in rats. Since the alveolar PCO2 is determined by the ratio of CO2 production to the alveolar ventilation, the higher ventilation for a given CO2 production leads to a larger decrease in alveolar PCO2 in rats than in humans as exercise intensity increases. This is shown in 9B, which plots arterial PCO2 (it is traditionally assumed that PACO2 = PaCO2) as a function of CO2 production. In rats, the decrease in PaCO2 produced by exercise is accompanied by a proportionate increase in arterial PO2; however, in humans, PaO2 decreases as exercise intensity increases. (9C). This results in the A-a PO2value decreasing in humans and remaining unchanged in rats (9D). The value of A-a PO2 is determined by the diffusing capacity for O2, and the extents of VA/Q heterogeneity and of the veno-arterial shunt. While the relative role of these factors in the differences in exercise gas exchange between rats and humans is unclear, it is apparent that efficacy of pulmonary gas exchange is greater in rats since, in contrast to humans the decrease in PaCO2 produced by the increase in ventilation is accompanied by a proportionate increase in arterial PO2.
Figure 10 Teaching points: According to the Fick equation, O2 consumption equals the product of the rate of O2 delivery times the O2 extraction. VO2 = (Q * Ca-vO2) = ((Q *CaO2) * (Ca-vO2 /CaO2)) 10A is a plot of O2 consumption as a function of the rate of delivery of O2 to the tissues; accordingly, the straight diagonal lines represent constant values of O2 extraction. At rest, rats maintain a greater mass-specific VO2 by a combination of greater O2 delivery and O2 extraction than humans. During exercise, VO2 increases via a combination of increases in delivery and extraction of O2 in both species. As exercise near maximum, the greater VO2 achieved by rats is the result of a greater rate of O2 delivery and similar O2 extraction ratios compared to humans. 10B illustrates that resting venous O2 content is lower in rats; since CaO2 is similar in both species, this shows that even at rest, O2 extraction is greater in the rats. During exercise, venous O2 content decreases in both species, with rats reaching a lower average than humans. Venous PO2 during exercise is consistently higher in rats than in humans, reflecting the lower Hb O2 affinity in the former. This is the result of two factors: first, standard Hb P50 is higher in rats; second, the effect of acidosis in decreasing O2 affinity of Hb, the Bohr effect, is greater in rats. Accordingly, for any level of exercise, venous PO2 tends to be higher in rats. Since venous PO2 reflect tissue capillary PO2, the difference between species suggests that rats are able to maintain a greater capillary PO2, and therefore a greater blood-tissue O2 diffusion gradient than humans during maximal exercise. In 10C, the Fick equation is plotted in a different manner: in this case, Q is plotted as a function of VO2, with each straight line representing a constant value of the a-vO2 difference. This graph illustrates that both at rest and exercise, a greater VO2 is achieved in the rats by a combination of both a greater cardiac output and a-vO2 difference than those of humans.
Figure 11Teaching points: The main point of this figure is that the increase in cardiac output (HR*SV) associated with exercise is brought about by different mechanisms: in the rat, cardiac output increases via an increase in heart rate, without any substantial increase in stroke volume, while in humans the increase in cardiac output associated with exercise is mediated by increases in both heart rate and stroke volume.
Figure 12Teaching points: This figure shows that, in spite of some quantitative differences, the general pattern of exercise-induced acid-base changes is similar in humans and rats. In general, for any given exercise intensity, as estimated from the O2 consumption level, arterial blood pH is higher in rats (12A and B). This is due to two factors: a lower PaCO2 (12A), which is a consequence of the greater exercise-induced alveolar ventilation in rats, as described before. In addition, rats show a lower base deficit. This could be due to more effective non-respiratory mechanisms of acid-base balance in the rat than in humans, coupled with a smaller generation of protons not associated with CO2. Blood lactate levels, which can be interpreted as an indirect marker of the generation of protons not associated with CO2, are lower in rats for a given level of exercise intensity. This could be interpreted as a smaller contribution of this mechanism of acidosis in rats. The individual contribution of this mechanism and of more effective buffering is difficult to ascertain.
Figure 13Teaching points: This figure illustrates the early ventilatory response to hypoxia, expressed as percent of the ventilation in normoxia. The increase in total minute ventilation (tidal volume × frequency) is greater in the rodents than in humans. This difference is related to the manner in which ventilation increases: while the relative increase in tidal volume is similar in the three species, respiratory frequency remains unchanged in humans, thus resulting in a smaller relative increase in ventilation compared to the rodents.
Figure 14Teaching points: The decrease in resting O2 consumption (14A) is a typical response of small animals, including rodents, to acute hypoxia. This is likely a protective mechanism that contributes to attenuate the decrease in PaO2 that follows hypoxia. Accordingly, for a given PaCO2 value, PaO2 in acute hypoxia tends to be greater in rodents than in humans (14B).
Figure 15Teaching points: As indicated before, mass-specific normoxic VO2max is greater in rats than humans. Acute hypoxia, induced by lowering inspired PO2 results in proportionally similar decreases in VO2max in both species, so for any level of hypoxia, VO2max continues to be greater in rats.
Figure 16Teaching points. A is a plot of arterial PO2 as a function of inspired PO2 of humans at rats exercising maximally. During normoxic exercise (PIO2 ∼ 150 Torr), PaO2 is similar in humans and rats. While lowering PIO2 leads to a decrease in maximal exercise PaO2 in both species, the relationship is less steeper in humans, such that rats are able to maintain PaO2 similar to humans exercising at a more severe level of hypoxia. B shows that in contrast to the pattern exhibited by humans, rat PaO2 actually increases form rest to maximal exercise under hypoxic conditions.
Figure 17Teaching points: This figure shows that two separate mechanisms are responsible for the greater PaO2 of rats during maximal exercise. A shows that at any given level of inspired PO2, PaCO2 is lower in rats, as a result of the greater ventilatory response of rats to exercise, which contributes to increase PaO2 for any level of hypoxia. Secondly, while human A-a PO2 during maximal exercise increases with more severe hypoxia, it remains essentially independent of PIO2 in rats. This is the result of a greater efficacy of pulmonary gas exchange, which for a given level of alveolar ventilation allows the rodents to maintain a PaO2 value closer to the alveolar PO2 than humans. The mechanisms responsible for this increased efficacy of gas exchange are described in Figure 18.
Figure 18Teaching points: This figure illustrates the concept that O2 equilibration between alveolar air and capillary blood is determined by the relationship between diffusive and perfusive O2 conductances, D/ßQ , where ß is the slope of the curve relating blood O2 content and PO2. In this example, Dapp nearly doubled in rats, while it increased by only 50% in humans. On the other hand, the much smaller exercise-induced increase in cardiac output of rats (∼60 % vs. more than double in humans) coupled with the greater rightward shift of the ODC (decrease in ß) leads to a smaller increase in perfusive conductance ßQ in the rodents. As a result of this combination of factors, A-aPO2 increased from rest to maximal exercise in humans, while it actually decreased in rats.
Figure 19Teaching points: This figure shows the effect of increasing Hb-O2 affinity on alveolo-capillary PO2 equilibration of rats. The data were obtained during maximal exercise. Isovolumic exchange transfusion of blood obtained from rats treated with sodium cyanate lowered Hb P50 to values similar to those seen in humans. PAO2, VO2max, VA/VO2, and cardiac output were similar in both cases. The greater HbO2 affinity (lower P50) induced by sodium cyanate determined that the increase in O2 content that follows the transfer of O2 from the alveoli as blood flows though the pulmonary capillaries, would be associated with a smaller increase in blood PO2 than that seen under control conditions. Accordingly, in the presence of similar PAO2 values in both cases, the higher O2 affinity of Hb leads to an increase in the A-aPO2 difference to values similar to those normally seen in humans exercising in hypoxia.
Figure 20Teaching points: Maximal QO2, the product of cardiac output and the arterial O2 content, is greater in rats than in humans at all PIO2 levels shown. (A) This is due to a greater cardiac output in rats. (B) In both species, the hypoxia-induced decrease in QO2max is largely due to the reduction in CaO2, since maximal cardiac output is not substantially affected by hypoxia.
Figure 21Teaching points: This figure provides information on the effects of hypoxia on blood-tissue O2 transport in hypoxia. Figure 21A shows a plot of maximal O2 consumption as a function of the maximal rate of O2 delivery. The slope of this relationship is, by definition, the O2 extraction ratio (O2ER). In other words, if the tissues would extract all the O2 delivered, VO2max would be equal to QO2max, and the slope of the relationship VO2max/QO2max would be = 1. It is apparent that the percentage of the O2 delivered that is extracted by the tissues at maximal exercise is similar in both species, and is over 85%. O2ER is directly proportional to the diffusing capacity of the tissue, and inversely proportional to the circulatory conductance. In other words, as we saw in Figure 18 when applied to the lung, O2ER = D/ßQ, with D in this case being the diffusive conductance of the tissue, rather than that of the lung as shown in Figure 18. If one assumes that at VO2max the majority of O2 is consumed by skeletal muscle (an assumption that is more valid in running quadrupeds) and that the PO2 in the muscle mitochondria is near zero (as suggested by direct and indirect estimates), then tissue diffusing capacity is equal to VO2max/mean capillary PO2. Mean capillary PO2 can be integrated from the value of arterial and venous PO2, and, for a given PaO2, is proportional to mixed venous PO2. Figure 21B shows that the slope relating VO2max to mean venous PO2 is similar in both species, suggesting a similar value for tissue diffusing capacity in both species. Given that O2 extraction is the ratio of diffusive to perfusive conductances, and that both O2 extraction and diffusive O2 conductance are similar in rats and humans, it follows that convective O2 conductance, that is, the product ßQ, must also be similar in both species. In fact, in the example of figure 18, ßQ is 1.59 and 1.66 mL/ (min* mm Hg) in humans and rats, respectively. While Qmax is greater in the rat than in humans, ß is lower (see Figure 18) such that the product is similar in both species. In summary, the evidence suggests that rats and humans have similar tissue O2-extraction ratios due to similar diffusive and perfusive conductances in both species.
Figure 22Teaching points: This figure shows the changes in VO2max and in the determinants of maximal O2 delivery to the tissues upon exposure to acute hypoxia (AHx), during prolonged (∼ 3 weeks) exposure to hypoxia (CHx), and upon return to normoxia after acclimatization (Acc Nx). While there are some quantitative differences—in part due to the difference in hypoxic PIO2 (∼ 70 Torr for the rats vs. ∼ 90 Torr in humans)—the general pattern is similar in both species. Acute hypoxia lowers VO2max in both species as a result of the reduction in QO2max; this, in turn, is largely due to the decrease in blood O2 content, without much change in cardiac output. During prolonged hypoxia, CaO2 increased toward control values thanks to the increase in Hb concentration; however, QO2max (and VO2max) did not change appreciably compared to acute hypoxic values. This is the result of the concomitant decrease in Qmax in both species. Return to normoxia naturally results in an increase in CaO2 above the initial normoxic values, since Hb concentration is now higher than before exposure to hypoxia, and HbO2 saturation is essentially 100%. In spite of the high CaO2, neither VO2max nor QO2max increase above the initial normoxic values, largely because Qmax remains lower than the initial normoxic values. In summary, while acclimatization results in an increase in blood O2 carrying capacity, this is not translated into an increase in VO2max as a result of the decrease in maximal cardiac output below preacclimatization levels.
Figure 23Teaching points: The graph on the left shows the results of a study comparing the time course of the ventilatory response to prolonged hypoxia in rats versus humans. While PaCO2 is determined by the ratio of CO2 production to alveolar ventilation, the changes in PaCO2 depicted here parallel changes in minute ventilation measured independently. While both species show ventilatory acclimatization, it is clear that the ventilatory response to hypoxia is greater in rats, and the difference between species is maintained for the duration of the hypoxic exposure. The figure on the right shows that differences between species are also present during maximal exercise. Ventilatory acclimatization is evidenced by the lower PaCO2 values for a given PaO2 in acclimatized (triangles) versus nonacclimatized (circles) individuals of both species.
Figure 24Teaching points: This graph summarizes the effects of acclimatization on the efficacy of pulmonary gas exchange during maximal exercise. In humans, acclimatization is associated with a decrease in the A-aDO2 during maximal hypoxic exercise. This suggests an increase in the efficacy of pulmonary gas exchange during acclimatization: for a given level of Inspired PO2, the arterial PO2 is closer to the alveolar value. The mechanism responsible for this increased efficacy is not known; however, the observation that pulmonary diffusing capacity is increased in humans after acclimatization is consistent with this observation. On the other hand, acclimatization has no appreciable effect in the A-aDO2 of rats. It is possible that this is related to the fact that, in the rat, maximal hypoxic exercise A-aDO2 is already much lower than in humans before acclimatization. Accordingly, any improvement in the pulmonary gas-exchange system brought about by acclimatization may have little discernible effect in a system that already has great efficacy.
Figure 25Teaching points: This figure shows values of blood Hb concentration of humans and rats before and after exposure to hypoxia for at least 2 weeks. It is apparent that rats are able to generate a greater Hb level for a similar hypoxic stimulus. Other things being equal, this response will result in a greater blood O2 content; this in turn will tend to attenuate the decrease in convective O2 delivery that follows hypoxia. These data are consistent with those in Figure 22, which show that on return to normoxia after acclimatization, when PaO2 is similar in both species, CaO2 is much greater in rats than humans.
Figure 26Teaching points: Maximal cardiac output is plotted as a function of the corresponding arterio-mixed venous blood O2 content difference. The dotted lines represent constant values of maximal O2 consumption. The data summarize the effects of altering the hematocrit (Hct) on VO2max and its determinants during maximal exercise in hypoxia (PIO2 ∼ 70 Torr) in rats acclimatized to hypoxia and in nonacclimatized rats. At the “physiologic” Hct of 45% for nonacclimatized rats and 60% for acclimatized rats, Qmax is lower in the acclimatized rats. Increasing Hct of nonacclimatized rats from ∼45% to ∼60% resulted in an increase in CaO2 and C(a-v)O2, and a decrease in Qmax; however, Qmax remained higher than that of the acclimatized rats at the same Hct. At this point, both groups showed essentially the same VO2max, but this was reached by different mechanisms in each group, with Qmax being higher and C(a-v)O2 lower in the nonacclimatized rats. This is another illustration of the consequences of the limitation in maximal cardiac output that follow acclimatization.
Figure 27Teaching points: A shows the average values of maximal O2 consumption plotted as a function of the corresponding convective O2 delivery. Data were obtained from the same groups shown in the figure; in this case, the effects of exercise in normoxia are also shown. By definition, the slope of the line relating O2 consumption to O2 delivery is the tissue O2 extraction ratio. It is apparent that O2 extraction ratio is similar in all groups. Tissue O2 extraction is determined by the relationship between the diffusive-to-perfusive O2 conductances. B shows VO2max plotted as a function of mixed venous PO2, a relationship that reflects the O2 diffusive conductance. The increase in VO2max of the nonacclimatized rats produced by the increase in Hct occurred in the presence of unchanged O2 extraction. This indicates that the greater VO2max in this case must have been achieved by a simultaneous increase in O2 diffusive conductance, as suggested by the steeper slope of the VO2max /PvO2 relationship.
Figure 28Teaching points: This figure shows plots of VO2max as a function of mean venous PO2 for two different rat generations of high- (HCR) and low-capacity runners (LCR). The straight solid lines represent the Fick diffusion equation: VO2 = DTO2 * (Pcap-Pcell) O2.The assumption is that, during maximal exercise, when most of the O2 in quadrupeds is consumed by the exercising muscles, and the skeletal muscle cell PO2 is near zero, the mixed venous PO2 reflects the O2 diffusion gradient between capillary and cell, and the slope of the line is proportional to the muscle diffusing capacity. The dotted lines represent the Fick Principle = VO2 = Q * C(a-v) O2; at PvO2 = 0, VO2 = QO2. The lines representing the Fick principle and Fick's Law of Diffusion intercept at the value of VO2max. In other words, VO2max is the highest VO2 that can satisfy both mass conservation and the limits imposed by a finite diffusing capacity. At generation 7, the difference in VO2max between HCR and LCR (both in hypoxia and normoxia) is exclusively due to a greater DTO2 in HCR: the slope of the line VO2max /PvO2 is steeper in HCR, and the maximal rate of convective O2 delivery, QO2max, is essentially the same in both groups, as indicated by the fact that VO2max at PvO2 = 0 (by definition QO2max) is the same in both groups. By generation 13, the differences in VO2max between HCR and LCR have increased compared to those in generation 7. This is due to an increase in the difference in DTO2 between groups, as indicated by the larger difference between the slopes of the straight lines representing Fick's Law of diffusion, combined by a greater QO2max in HCR, as demonstrated by the higher VO2max at PvO2 = 0 in this group compared to LCR.
Figure 29Teaching points: Tissue diffusing capacity, DTO2, as defined in the previous figure, was determined during hypoxic (open symbols) and normoxic maximal exercise (solid symbols). DTO2 is plotted as a function of capillary density of the medial gastrocnemius, determined by morphometric analysis. As expected, since capillary density is a major determinant of O2 diffusion at the tissue level, there is a strong correlation between DTO2 and capillary density. The differences between strains are already substantial at generation 7 (circles) and become greater at generation 13 (triangles). These data show that the physiological differences between the two strains determined from gas-exchange measurements are strongly supported by the structural features estimated via morphometric analysis.
Figure 30Teaching points: A shows minute ventilation and arterial blood gases as a function of the duration of hypoxic exposure in two strains of rats, Hilltop and Madison, which show different adaptive characteristics to hypoxia. As expected, minute ventilation increases rapidly with some indication of ventilatory acclimatization as suggested by a tendency for a secondary increase at 2 to 3 days of hypoxia. Importantly, there are no significant differences in ventilation between strains. This is consistent with the similar values of PaCO2 seen in both species throughout the hypoxic exposure. In contrast, the Hilltop strain shows a significantly lower PaO2 value starting at 2 weeks of exposure. The lower PaO2 in the presence of similar ventilation and PaCO2 suggest abnormal pulmonary gas exchange, which may include increased VA/Q heterogeneity and /or decreased pulmonary O2 diffusion. These features may be related to the structural lung changes associated with prolonged pulmonary hypertension, another feature of the Hilltop strain.
The Hilltop strain also shows exaggerated polycythemia, which results in a greater hematocrit compared to the Madison strain. The excessive generation of red blood cells is illustrated by the greater proportion of reticulocytes in Hilltop compared to Madison, particularly in the early phase of hypoxia exposure.
Submit a note to the editor about this article by filling in the form below.
* Required Field
How to Cite
Norberto C. Gonzalez, Ichiro Kuwahira. Systemic Oxygen Transport with Rest, Exercise, and Hypoxia: A Comparison of Humans, Rats, and Mice. Compr Physiol 2018, 8: 1537-1573. doi: 10.1002/cphy.c170051